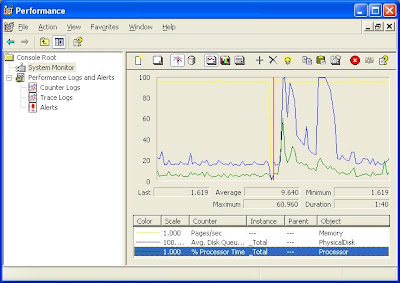
Starting Perfmon & adding counters
1). Go to Start menu, select Run. Type perfmon and press OK.
2). Perfmon by default display/monitor the counters,
-Pages/Sec(Memory)
-Avg.Disk Queue Length(Physical Disk)
-% Processor Time(Processor).
3). For adding new counters right click and select Add Counters. Select Performance Object from the drop down, select Performance Counter from the list and Instances from the list. Press Add button and Close the Add Counters dialog. Now you can see the value & graph plotting.
Saving Log file
1). Expand Performance Logs and Alerts tree item in the left pane of the Perfmon and select Counter logs.
2). Right click on the Perfmon right pane shown and choose New Log Settings. Enter the name of the log you want to have and press OK.
3). Press the Add Counters button on the log configuration dialog shown and choose the needed counters to monitor and save to file.
4). You can configure many options such as data capture Interval, Log file type, Schedule etc in the Log Configuration dialog.


No comments:
Post a Comment